

2025 Roundabout, #2
Trying to make sense of Carlton’s flatlining offensive output.

There were so many topics I wanted to write about this week – St Kilda’s ambush of Geelong, North Melbourne’s surprise thrashing of the Dees, West Coast taking it up to Brisbane, why Riley Thilthorpe is the truth, just to name a few. But, as the words and charts just kept flowing, I realised I only had time and space for one: a deep dive of why Carlton has lost so much of its scoring power.
So, apologies to Geelong, North Melbourne, West Coast and Thilthorpe fans – you will have your day.
As always, my mood is immeasurably improved by hearing from readers, so please chip in below the line, on socials, or even via email with your thoughts – not just on the specific subjects I’ve covered, but anything from the weekend’s games.

There are inside-50 entries [shakes head], and there are inside-50 entries [grins, nods]
Riley Beveridge, one of the AFL’s house scribes, wrote a good piece last Thursday highlighting Carlton’s dysfunctional forward-50 entries. Probably the most salient statistic Beveridge cited in his piece is that, in Carlton’s optimism-sapping Round 1 defeat to Richmond, almost two-thirds of the Blues’ 65 inside-50 entries originated from further than 70 metres out from goal. That wasn’t just the highest rate of forlorn bombing of the whole round, it continued a rather dismal trend that’s been ongoing since at least midway through the 2024 season. Despite the presence of two of the AFL’s best key forwards (although it should be noted that Charlie Curnow missed the final three games of last season), Carlton have been struggling when it comes to inside-50 mark rate, retention rate, and scoring rate for some time.
I thought it would be worthwhile to dig deeper into the numbers to understand precisely when the decline began, and offer some tentative reasons for how it happened. The first thing to do is to establish that Carlton’s scoring output has actually declined. The evidence for that is fairly clear:
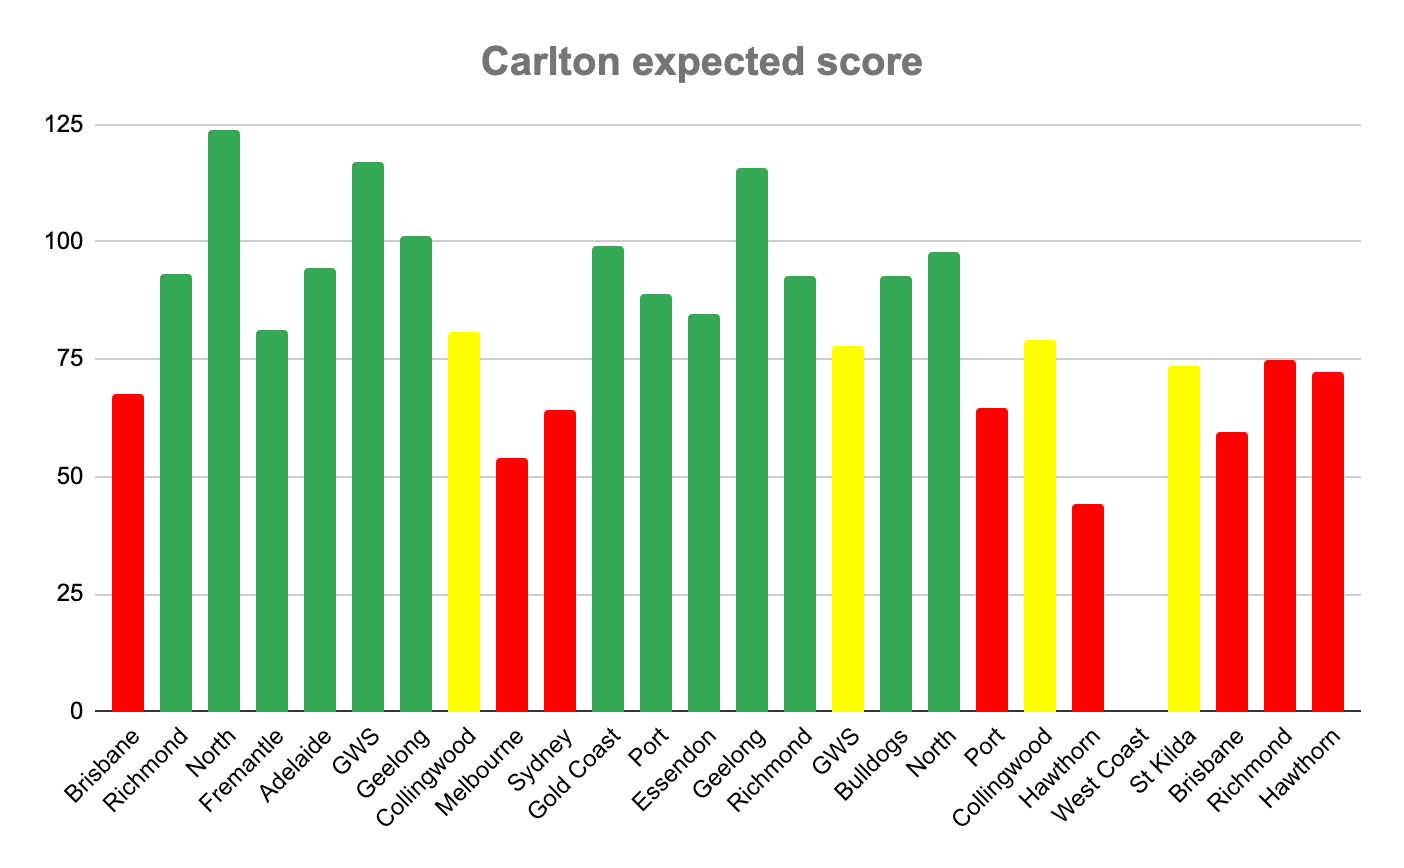
This chart above shows Carlton’s expected score in every game they’ve played since the beginning of last season. Every instance where Carlton kicked an expected score at least 10 greater than the 2024 average across the entire league (81.0) is shaded green. All games where they scored within 10 of the average (so, between 71.0 and 81.0) are shaded yellow. The angry reds are reserved for the games where the Blues didn’t get within 10 of the season average expected score – including the first two games of 2025, where the average league-wide expected score is currently 85.0. Although I couldn’t find their expected score for Carlton’s Round 23 game against West Coast, I’d be fairly confident they exceeded an expected score of 81 (they kicked 99 points and were barely troubled in a 65-point win). But that looks increasingly like a green oasis in a desert of red and yellow.
As Beveridge touched on his piece, Carlton’s issue isn’t the quantity of inside-50 entries they’re generating, it’s the quality.

The chart above shows Carlton’s raw inside-50 numbers since the beginning of 2024. All the green columns represent games where the Blues had more entries than the overall season average (51.8 in 2024, currently 53.2 in 2025), the red columns where they had fewer. It’s fairly steady. What’s declined is Carlton’s ability to convert entries into shots:

All observations above the 2024 season average (48.1 percent) are shaded green, all those less than the average but still within five percent are orange, and all those outside that are red. Clearly, these graphs are displaying some closely-related trends: since their Round 20 home defeat to Port Adelaide, Carlton are generating fewer shots per inside-50 entry, and, as a direct result, struggling to generate winning scores.
With the downward trend established, let’s turn our attention to the how.
This post is free. But please consider supporting my work with a subscription.
Under Michael Voss, the Blues set up to win contests. In 2024, they ranked first for offensive one-on-ones, fourth for ruck contests (a proxy for per-game stoppage numbers), and first for contested possessions. Patrick Cripps wrestles the ball out of stoppages, and the ball is pummelled forward for Charlie Curnow to out-wrestle his direct opponent. It’s gladiatorial footy. Hammer and anvil. Inside, not outside. But, as the numbers clearly show, it’s become increasingly ineffective – and increasingly out-of-step with the way the game is trending.
Modern footy is increasingly about two things: how well you can move the ball, and how effectively you can stop your opposition doing the same. There are several ways to excel at either: you can use hands to get from the inside of the contests to the outside (like Hawthorn). You can use precise kicking to puncture opposition zones (like Adelaide have been doing this year). You can surge the ball forward and trust in the ability of your players to win contests in the front half (like Geelong). Defensively, you can press up high to win the ball back closer to your attacking goal, you can drop deeper and intercept aerially, or you can combine the two approaches. If I understood Champion Data’s Daniel Hoyne correctly in his most recent appearance on SEN, he said that, last season, punishing opposition turnovers from the half-back line contributed more to scoring than winning the contest for the first time. Apparently that was the first time this was the case in about a decade. And although Hoyne, unfortunately, didn’t elaborate on precisely what he meant by “the contest” (clearances, contested possessions – both?), it’s safe to say that Carlton are on the wrong side of that ledger. They are the dictionary definition of a contest-first side.
Carlton’s style of footy can be exhausting to watch. But it’s much more exhausting to play. I won’t join the chorus of people criticising Michael Voss for using Patrick Cripps as a second ruck – he’s good at it, and it creates a mismatch inside of the contest which the Blues can use to their advantage. But I have significant doubts about the ability of that style to hold up within games and across the season. Consider a very simple analogy: let’s represent each contest – stoppage, marking contest, etc. – as a coin flip with a 50 percent chance of success (heads) and a 50 percent chance of failure (tails). The way Carlton move the ball often requires several successive coin flips coming up heads to make progress. If you flip a fair coin three times, the probability of getting three consecutive heads is one-in-eight (12.5 percent). Let’s be very generous to Carlton and, in deference to the prowess of the likes of Cripps, Curnow and Weitering, set the probability of winning a contest (a coin coming up heads) at 55 percent. Even then, the numbers don’t really stack up. If you flip a rigged coin that comes up heads 55 percent of the time, you’ll get three consecutive heads 16.6 percent of the time – about one-in-seven. It’s tiring, it’s low-percentage – and it’s trending in the wrong direction.
What’s the opposite of contests? Uncontested possessions. And what’s the best way to advance up the field, fashion good-quality scoring opportunities (to ‘work the arc’, as per Beveridge’s article), and get your breath back? Uncontested marks. An underrated aspect of the decline in Carlton’s scoring power – beyond the vagaries of form and fitness – is the decline in their uncontested marking and, therefore, the decline in their ability to find low-risk methods of advancing up the field in possession.

Enjoying my forensic breakdown of why the Blues aren’t getting it done? Please consider sharing it with a mate!
Possession chains – the sum total of opposition turnovers forced, clearances won, and kick-ins taken – is the nerdy way of expressing a simple idea: how many times a team starts with the ball in a game of footy. Carlton, because of their clearance strength and (in 2024) their ability to force opposition turnovers, start with the ball more than most sides. In 2024, they had an average of 116 possession chains, compared to the AFL average of 113.6. But they’re a below-average uncontested marking side: ranking 10th among all sides in 2024 and 10th in the last 10 games. The comparison to the Adelaide vs. Essendon game – as fun as that was for this author – isn’t really a fair one: it was played in perfect conditions and Essendon’s defensive zone could best be described as “relaxed”. But it’s an indication of what it takes to generate quality inside-50 entries, and the scores to match.
The Crows took 97 marks in the midfield and forward zones of the ground last Saturday. The Blues – admittedly, in tough conditions, and up against a much tougher opponent – could only muster 11. For apparently only the fourth time on record, Carlton did not kick a single goal from a possession chain originating in their back half (their best passage of play, when Adam Saad dashed up from half-back to gather a ground ball and launch it deep inside 50, counted as a centre clearance goal because the ball never left the first layer).
The decline in Carlton’s ability to avoid contests when in possession is closely correlated with their deliberate decision to quicken up their ball movement last season. This chart, by friend of the newsletter, James Ives, tells the story.
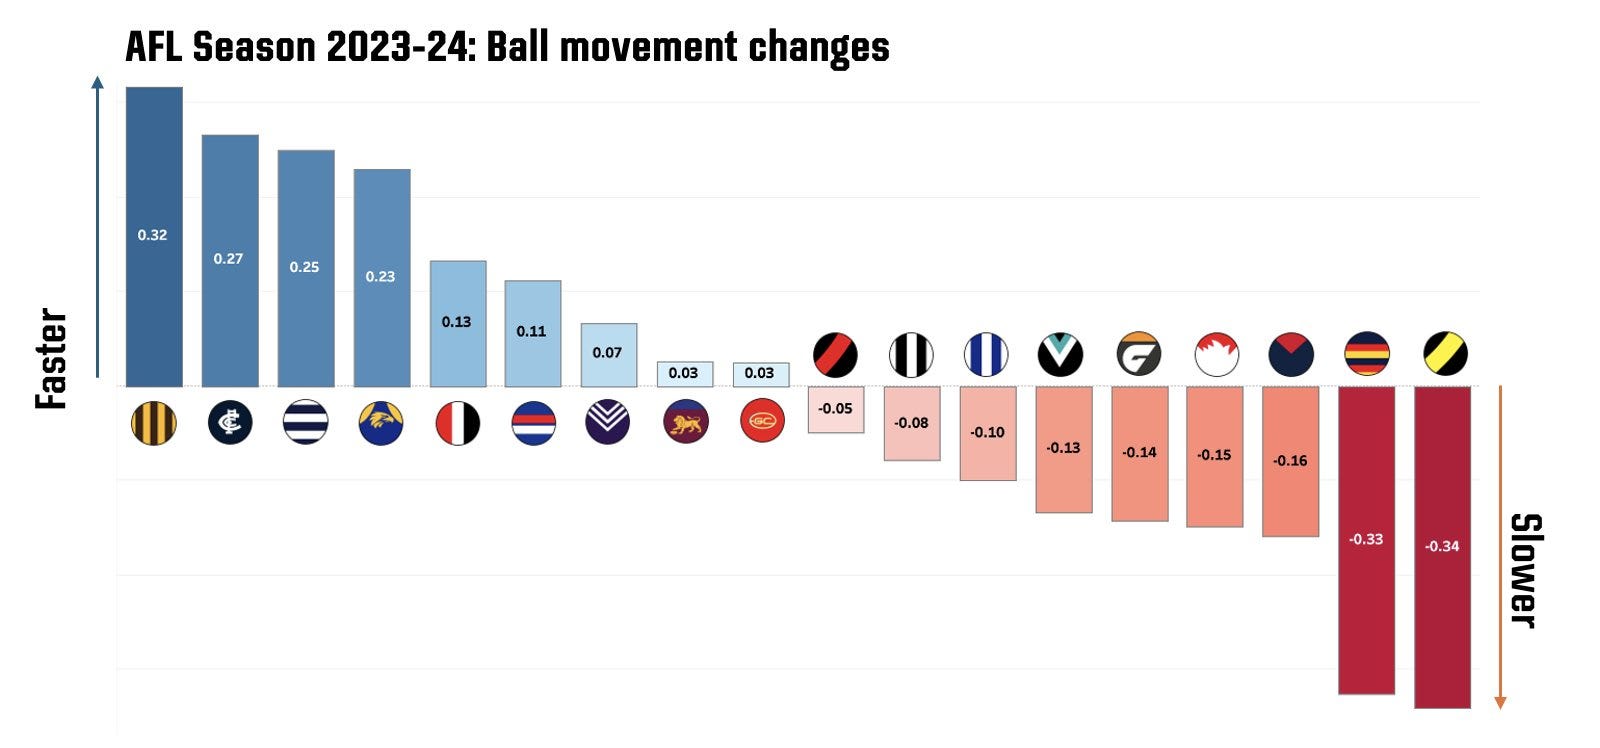
Extra speed on the ball made Carlton better at punishing opposition turnovers but more vulnerable to conceding from their own turnovers and, because they often floated a spare outside of the contest, meant the Blues bled higher scores from stoppage losses.
I suspect that these twin factors – the decline in Carlton’s uncontested marking, together with greater speed when in possession – are jointly responsible for what I posit is the single biggest reason for the collapse in Carlton’s scoring efficiency. I promise this is the final chart in this week’s newsletter.

I’ve defined Carlton’s six best users by foot as (in no particular order) Zac Williams, Nic Newman, Charlie Curnow, Adam Cerra, Elijah Hollands, and Harry McKay. The likes of Mitch McGovern and Jordan Boyd might consider themselves unfortunate to not have made this illustrious list. And I’ve taken some liberties with the pass mark: 25 percent of inside-50 entries. I don’t know how other clubs would fare on this measure. Clearly, there’s some subjectivity here. And one can dispute the strength of the correlation – Carlton’s best performance of the season, their Round 15 drubbing of Geelong, fell well below my arbitrary 25 percent threshold. But I still think there’s a story here: two-thirds of the way through the season, the Blues became much worse at getting the ball into the hands of their best users and, as a result, became significantly less potent. I’ve suggested a couple of potential reasons why. Speed sacrificing precision. Form. Injuries. I’d love to hear any other theories from Carlton fans.
There’s been so much talk about whether personnel or game plan is to blame for the Blues’ blues. The uncomfortable truth is that it’s both. Carlton, under Michael Voss, paint in thick, heavy, straight lines. They are desperately predictable. Opponents know that if you apply enough pressure on the inside, the indiscriminate kick delivered in hope to a familiar spot will eventually come. They are not doing nearly enough damage with either run and carry or with handballs. The correlation between winning contests and winning games of footy has never been weaker. But, as the rest of the AFL is zigging, Carlton (and Melbourne) are zagging. That doesn’t mean they’re doomed to fail. Premierships are often won by sides that go against the grain. But, as the weeks pass, tension is building. And the most concerning element for Blues fans is that, when you examine the skill and age profile of their list, the club seems locked in to its current course. Game plan is shaped by list profile to a greater degree than is commonly understood. Sam Mitchell couldn’t get this Carlton list playing the same way as his Hawthorn side – there are too many big bodies and not enough elite kicks. Curnow and McKay’s gravitational field draw the ball near them, even if the long kick isn’t the right option. At a time when virtually all the leading sides boast an array of damaging, skilful small/medium forwards, I’m not sure Carlton have any. The connection between the midfield and forward zones is clearly lacking. I’ve only scratched the surface of what’s going on. Voss has found solutions before. Let’s see what happens.
Semi-fun facts and figures:
St Kilda! The Saints restricted the Cats to just 135 disposals in the first half of Saturday night’s game while amassing 210 of their own (for reference, the 2024 season average for full games was 362.3). Nasiah Wanganeen-Milera and the outstanding Jack Sinclair were the twin conductors, making sure the ball stayed in motion and out of the cats’ paws. I think the sides that are best-played to jump up the ladder in future years are well-drilled sides that lack the talent to execute all the coach’s instructions. Hopefully the Saints can have enough wins in the draft and at the trade table in the next couple of years for us to see what kind of proposition they can become.
North Melbourne! Their return of 7.1 (!) scored from centre bounce was their highest on record and their 59-point victory over Melbourne their biggest winning margin since Round 9, 2020, when they slayed the Crows to the tune of 69 points. Guess which two teams are facing off on Sunday afternoon at Adelaide Oval?
Speaking of the Crows, there are several stats one could quote from their evisceration of the Bombers. Highest score by a non-Victorian side at the MCG since 2013. +70 for marks. +44.2 on expected score. Just the seventh time in the last ~2,000 games a side has kicked 25 or more goals. The focus of the footy media’s attention this week has – rightly – been on Windy Hill. But, on current form (albeit against modest opposition), Adelaide appear capable of climbing the ladder.
Fremantle have lost their last six games, spread across the seasons. Not great for a supposed flag fancy!
‘Til next week!